
Zip Income Data: Unlocking Trends for Smarter Financial Decisions

May
Zip Income Data: The Missing Link in Smart Local Business Decisions
Choosing where to invest your marketing dollars, open a new branch, or build a customer base is never simple. For real estate agents, mortgage brokers, insurance agents, home service providers, and local marketers, the stakes are high. One bad guess about a market’s true demand, or one missed detail about the people living in a ZIP code, can waste months of work and thousands of dollars. That’s why ZIP income data—and the larger world of ZIP-code-level demographic and economic signals—has become a critical tool for anyone making local business decisions.

But what does ZIP income data really tell you? Why does it matter more than citywide or county data? And how can you use it to drive smarter growth, better prospecting, and stronger local campaigns? Let’s dig into the details, practical uses, and common pitfalls of ZIP-level market research—so you can make every local move with real confidence.
Why Zip-code-level Research Beats Broad Data Every Time
When you look at a whole city or county, averages can hide the real story. For example, a metro area may seem wealthy overall, but some ZIP codes have much lower median household income. Other ZIP codes may be growing fast, attracting younger families, or shifting toward rental housing. Relying only on citywide stats can lead to missed opportunities or expensive mistakes.

ZIP-code-level data gives you a sharper lens. It reveals how neighborhoods differ in:
- Income and purchasing power
- Home values and housing types
- Population growth or decline
- Age, education, and household size
- Local competition and business mix
This detail is the difference between guessing and knowing. For example, a home service business might assume a city’s median income fits its target customer. But by zooming into ZIPs, they may find the ideal audience clusters in just a few neighborhoods—or that a “good” ZIP is already overserved.
When you make decisions at the ZIP level, you reduce risk and aim your effort where it’s most likely to pay off.
The Key Signals In Zip Income Data (and Why They Matter)
Not all income data is equal. The most useful ZIP-level stats go beyond simple averages. Here are the core signals to watch and what each one tells you:
Median Household Income
This is the middle point—half of households earn more, half less. It’s a fast way to see the typical buying power in a ZIP code. For home services, retail, and many B2C businesses, this number helps you match your pricing and products to real budgets.
Per Capita Income
This divides total income by the number of people, giving a sense of individual earning power. It can show if households are large and sharing income, or if singles and couples are driving the market.
Income Distribution
Are incomes tightly clustered, or is there a wide gap between rich and poor? A ZIP code with a high standard deviation may have both luxury and budget opportunities—but needs careful targeting.
Housing And Ownership Patterns
Income often shapes home values, rental rates, and whether people own or rent. ZIP-level data reveals:
- Average and median home prices
- Share of renters vs owners
- Vacancy rates
- New construction activity
These signals are vital for real estate agents, lenders, and insurance providers who need to know who is moving in, who can buy, and what types of properties are in demand.
Population Growth And Demographics
Income does not stand alone. Look at how a ZIP code’s population is changing:
- Is the area growing, shrinking, or stable?
- Are new residents younger, older, or more diverse?
- Is there a surge in families, singles, or retirees?
When you combine income data with age, education, and household type, you get a full picture of who lives there and what they need.
Business Presence And Local Competition
Knowing the number of competitors, types of businesses, and their longevity in a ZIP code can guide your strategy. If a high-income ZIP has few service providers or a retail gap, it may be a chance for new entrants.
Real-world Example: Comparing Two Zip Codes
See how ZIP income data can shape decisions with a side-by-side look:
| ZIP Code | Median Household Income | Population Growth (5 yrs) | Owner-Occupied Homes | Avg. Home Value |
|---|---|---|---|---|
| 90210 | $193,000 | +2.5% | 62% | $3,200,000 |
| 90019 | $68,000 | +5.1% | 38% | $850,000 |
Both are in Los Angeles, but serve very different markets. ZIP 90210 is affluent, with stable growth and high home values—suited for luxury real estate or premium services. ZIP 90019 is more affordable, growing faster, and has more renters—better for value-focused products or first-time buyer programs.
Using Zip Income Data For Smarter Local Decisions
Let’s look at how different professionals can use these signals in practice.
Real Estate Agents
Agents can:
- Target mailings and ads to ZIPs where income matches their listings
- Advise sellers on likely buyer profiles and price ranges
- Identify areas with rising incomes and property values for future growth
A common mistake: focusing only on “hot” ZIPs without checking if buyers there actually fit your property type or if the neighborhood is over-supplied with agents.
Mortgage Brokers
Brokers can:
- Pre-qualify leads by matching loan products to ZIP-level income
- Spot underserved areas where residents may need more lending options
- Avoid wasted marketing in ZIPs with low homeownership or stagnant incomes
Many brokers miss out by assuming that high home values always mean strong borrowing demand. Sometimes, incomes are too low for buyers to afford loans at current prices.
Insurance Agents
Insurance needs change with income and home values. Agents can:
- Tailor products to the risk levels and property types in each ZIP
- Find ZIPs with lots of new homeowners needing coverage
- Avoid ZIPs with high vacancy or declining property values
A non-obvious insight: ZIPs with rising incomes may see more interest in premium coverage, while growing rental markets need renter’s insurance.
Home Service Businesses
From landscapers to HVAC installers, ZIP-level data guides:
- Where to distribute flyers or run digital ads
- Pricing strategies based on local income and competition
- Expansion into ZIPs with growing, affluent populations
One easy-to-miss detail: ZIPs with high incomes but few owner-occupied homes may have less DIY demand and more interest in full-service options.
Local Marketers And Small Business Owners
If you run a local shop, service, or franchise, ZIP research helps:
- Pinpoint the best locations for a new branch or delivery zone
- Avoid saturated ZIPs with too many similar businesses
- Personalize offers and messages to local income and needs
A typical error: launching citywide campaigns without ZIP targeting, which often wastes budget on low-yield areas.
How To Gather And Analyze Zip-level Data
Getting ZIP income data is easier than it once was, but quality and detail vary. Here are the main sources and their pros and cons.
Government Sources
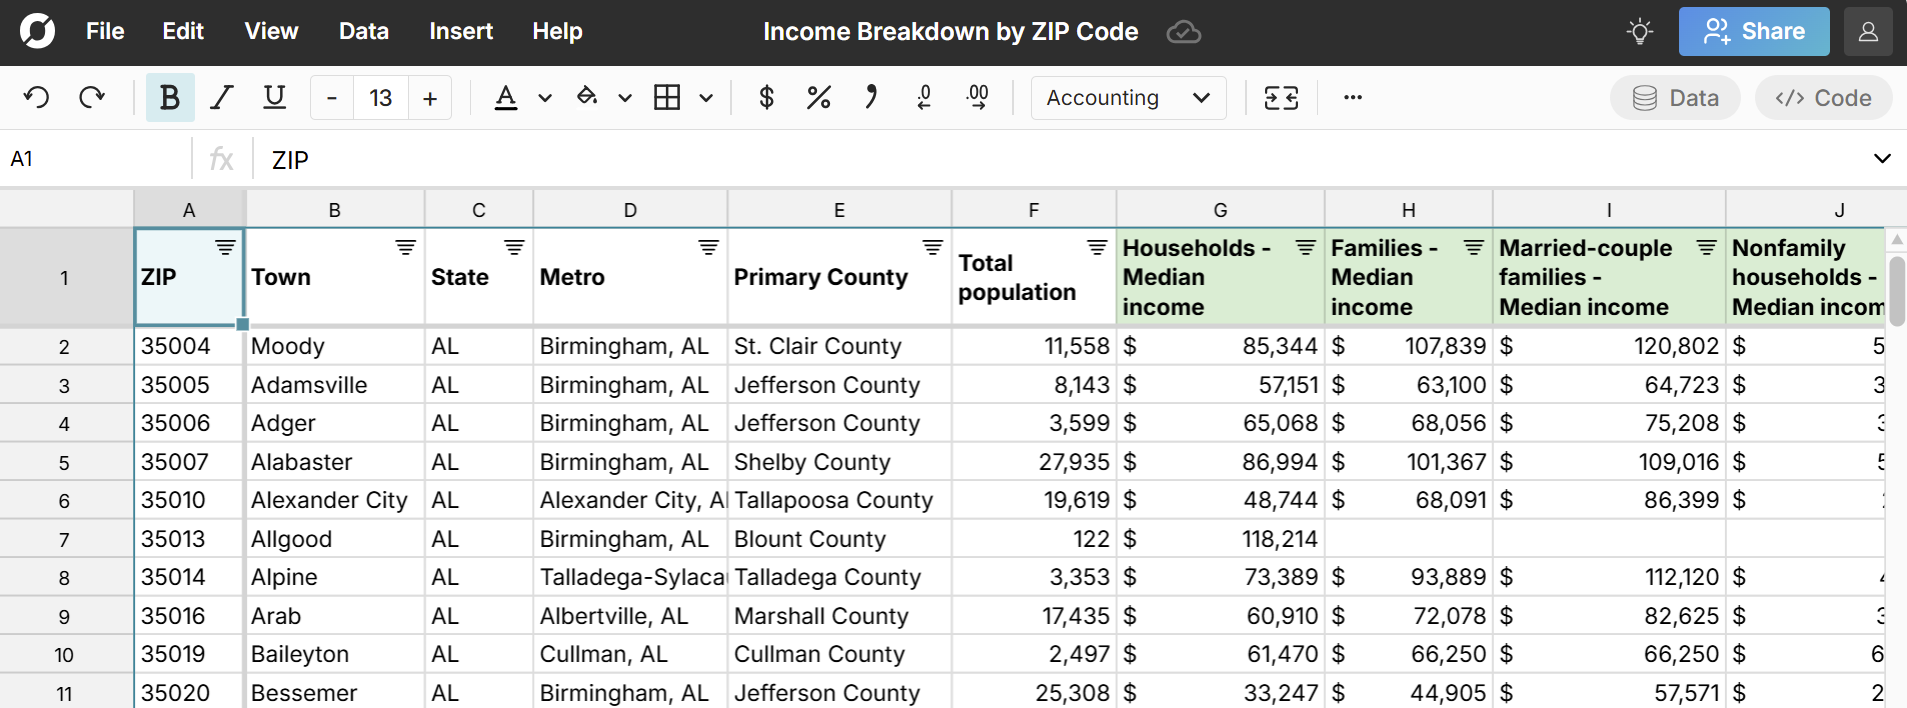
The U.S. Census Bureau’s American Community Survey (ACS) offers free ZIP-code-level data on income, housing, and demographics. It’s reliable and updated annually, but:
- Data can lag real changes by a year or more
- Small ZIPs may have limited or estimated info
- Downloading and filtering can be tricky for beginners
Commercial Market Reports
Paid tools like 360 Real Estate Reports collect, clean, and enhance public data with recent sales, business activity, and proprietary signals. Benefits:
- Faster updates and deeper local details
- Easy-to-use maps and charts
- Integration with CRM or marketing platforms
Some providers offer sample reports or free previews, which are a great way to test before buying.
Local Government And Planning Agencies
City or county planning offices sometimes release ZIP-level studies on housing, population, and economic trends. These can be useful for spotting infrastructure changes, zoning shifts, or upcoming developments.
Data Aggregators And Apis
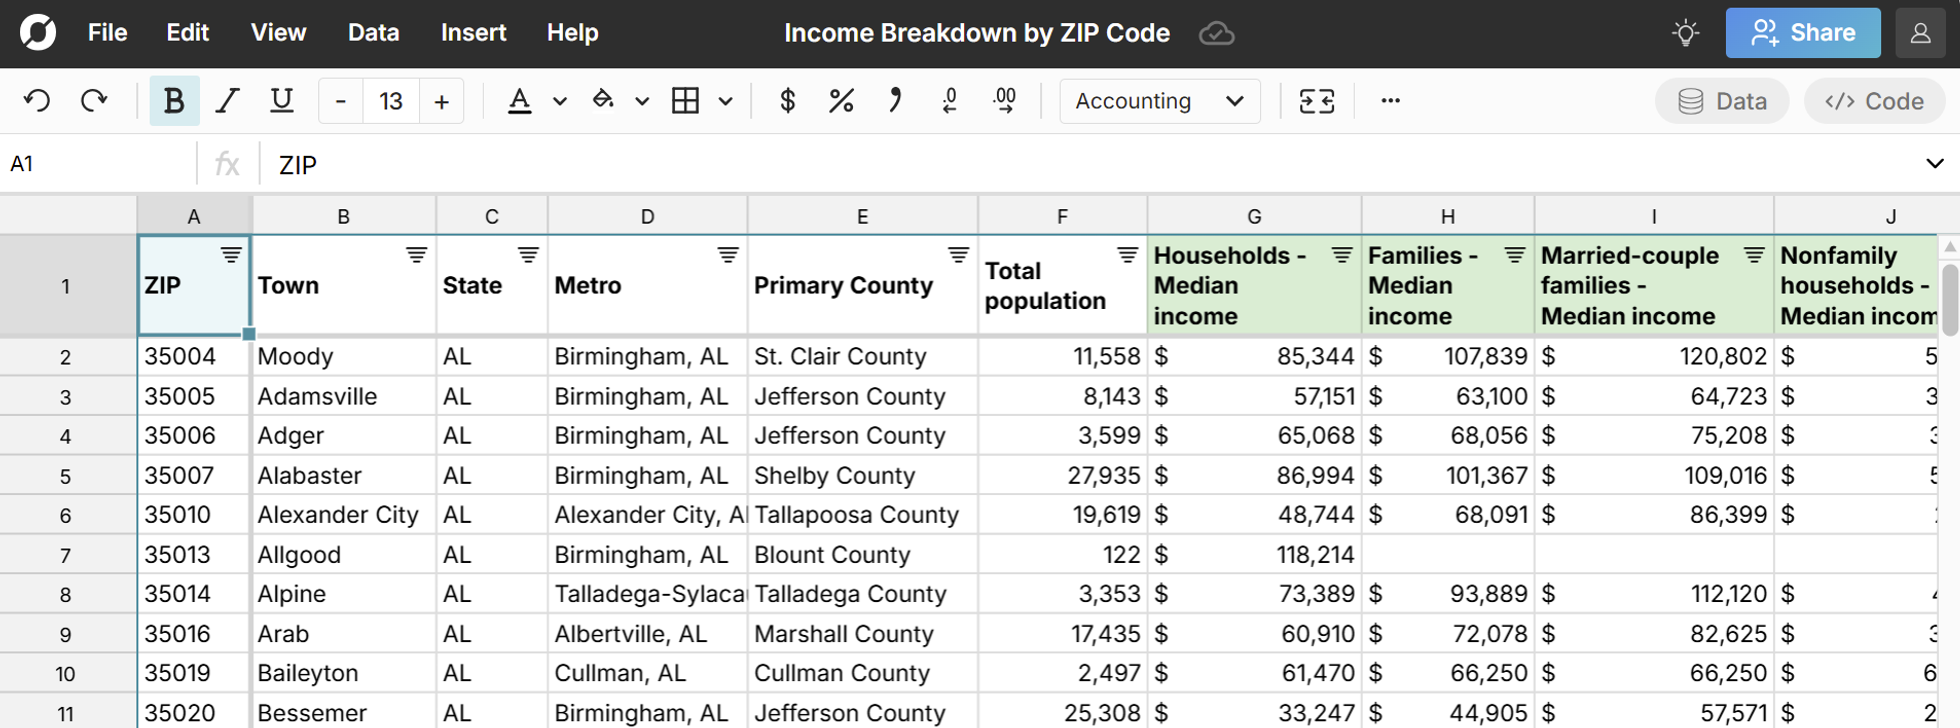
For tech-savvy users, APIs and databases from sites like Zillow or Data USA can supply ZIP-level stats for custom analysis. This is best for larger businesses with data teams.
Credit: rowzero.com
Data Table: Common Zip Income And Demographic Metrics
For easy reference, here’s how typical ZIP-level signals compare:
| Metric | What It Shows | Why It Matters |
|---|---|---|
| Median Household Income | Typical earning power | Matches products/services to budgets |
| Per Capita Income | Income per person | Highlights wealth concentration |
| Homeownership Rate | % of owners vs renters | Guides real estate and insurance focus |
| Population Growth | Recent changes in residents | Signals demand and opportunity |
| Business Density | Number/types of local businesses | Reveals competition and gaps |
How Businesses Use Zip Data Before Expanding Or Advertising
Let’s walk through a typical process for using ZIP income data to guide smart business moves.
1. Define Your Ideal Customer
Start with your current best customers—what are their typical:
- Income ranges
- Age and household size
- Homeownership status
- Service needs
2. Map Local Zip Codes
Use mapping tools or reports to visualize which ZIPs match your target profile. Look for:
- Clusters of high-income or growing populations
- Areas with low competition for your business type
- ZIPs with strong homeownership if you sell to homeowners
3. Score And Prioritize Zips
Assign scores to each ZIP based on how well they fit your criteria. Rank them for targeting in campaigns, outreach, or expansion.
4. Test And Measure
Start with a pilot campaign or test location in the highest-ranking ZIPs. Measure response rates, sales, and customer feedback. Adjust your strategy as you learn what works.
5. Scale Up Carefully
Expand into new ZIPs gradually, using fresh data every quarter to spot trends or shifts in demographics, income, or competition.
The Risks Of Skipping Zip-level Research
Too often, businesses make decisions based on intuition, citywide averages, or outdated word-of-mouth. Here’s what can go wrong:
- Over-saturating a market: Without ZIP data, you may enter an area already packed with competitors.
- Mispricing products: Citywide income may hide big ZIP-level differences, leading to prices that are too high or low.
- Missing emerging markets: Fast-growing or gentrifying ZIPs are often invisible in broader data.
- Wasting ad spend: Marketing citywide or by county can burn budget on ZIPs outside your real target audience.
A common mistake is to assume that one ZIP is “like” another nearby. Bordering ZIP codes can have very different incomes, housing, and business needs.
Advanced Insights: What Beginners Often Miss
Most new users of ZIP data look only at median income and stop there. But two less obvious patterns can make a big difference:
- Income Volatility: Some ZIPs have fast-changing income levels due to new housing, tech jobs, or gentrification. A ZIP with rising income trends may be a great “early entry” spot before competitors arrive.
- Daytime vs Nighttime Population: In business districts, many people work but don’t live there. For restaurants or services, daytime population may matter more than resident income. Some ZIP-level reports now include these patterns.
The Role Of Zip Data In Digital Marketing And Prospecting
Digital ads, direct mail, and outreach campaigns work best when you know exactly who you’re reaching. Here’s how ZIP-level insights boost your ROI:
- Ad Targeting: Use ZIP codes as filters in Google, Facebook, and direct mail platforms. Focus spend on high-potential ZIPs.
- Personalized Messaging: Reference local stats in your ads or mailings (e.g., “Serving 90210 homeowners for 15 years”).
- Lead Scoring: Assign higher value to leads from ZIPs that match your ideal profile.
One overlooked benefit: Using ZIP data to exclude low-value areas can save as much budget as finding the best ZIPs.
360 Real Estate Reports: Bringing It All Together
For those who want a ready-made solution, 360 Real Estate Reports combines public, commercial, and proprietary data into easy-to-read ZIP-level reports. You get:
- Up-to-date income, housing, and population stats
- Trends over time (not just a snapshot)
- Business competition and new construction signals
- Visual maps and comparison tools
This kind of all-in-one report is especially useful for agents, brokers, and marketers who need to make decisions quickly, without becoming data experts.
Credit: rowzero.com
How Zip Income Data Drives Local Business Growth (case Examples)
Let’s look at real-world situations where ZIP-level research made a clear difference.
Home Service Business: Hvac Company Expansion
An HVAC firm wanted to expand in the Phoenix area. Citywide data showed healthy incomes, but they used ZIP-level reports to dig deeper. They found:
- Two ZIPs with high homeownership, rising incomes, and older homes (likely to need upgrades)
- One ZIP with high incomes but mostly new homes (less immediate need)
- Several ZIPs with low incomes and heavy renter populations (less demand for HVAC installs)
They focused their mailers and ads on the first two ZIPs, saw a 30% higher response rate, and reduced wasted spend.
Mortgage Broker: New Loan Product Launch
A broker wanted to launch a product for first-time buyers. Using ZIP income, home value, and age data, they found pockets of young, moderate-income households near tech hubs. Instead of citywide ads, they targeted only those ZIPs—getting more qualified leads and faster closings.
Insurance Agent: Renter’s Insurance Campaign
An agent noticed that one ZIP had a sudden spike in rental properties and young residents. Even though median income was lower than average, the growing renter base meant strong demand for renter’s insurance—something missed by agents focusing only on homeownership ZIPs.
Table: Comparing Zip-level, Citywide, And Countywide Data
To see why ZIP-level signals are superior for most local decisions, compare these data types:
| Data Level | Pros | Cons | Best Uses |
|---|---|---|---|
| ZIP Code | Highly local, detailed, reveals hidden trends | May miss cross-ZIP trends, requires more data handling | Targeted marketing, branch/site selection |
| Citywide | Good for broad trends, easy to get | Hides local differences, can mislead targeting | Market overviews, PR, general planning |
| Countywide | Broadest view, shows regional shifts | Least useful for local business moves | Regional expansion, state-level strategy |
Credit: www.incomebyzipcode.com
Practical Tips For Using Zip Income Data Effectively
- Use recent data: Markets change fast. Always check dates on your sources.
- Look for trends, not just snapshots: Rising or falling incomes, population shifts, and new construction can matter more than current numbers.
- Combine income with other signals: Don’t ignore housing, age, and business mix.
- Visit key ZIPs in person: Data is best when paired with local knowledge. Walk the area, look for new businesses, talk to residents.
- Update your ZIP strategy quarterly: Demographics and business competition shift quickly in growing regions.
- Watch for boundary quirks: ZIP codes don’t always match city or neighborhood lines. Double-check maps for accuracy.
- Consider using a professional report: Services like U.S. Census ACS or 360 Real Estate Reports can save hours and avoid common mistakes.
Common Mistakes When Selecting Markets Without Zip Data
- Overgeneralizing: Assuming all neighborhoods in a city are similar.
- Ignoring income distribution: Only looking at median, not the spread of incomes.
- Missing demographic changes: Not spotting new trends in age, household size, or ownership.
- Underestimating competition: Launching in ZIPs with too many similar businesses.
- Relying on old data: Using stats that are more than two years old.
Correcting just one of these mistakes can dramatically improve your local marketing results and investment returns.
Frequently Asked Questions
What Is Zip Income Data, And Where Does It Come From?
ZIP income data shows the average, median, and distribution of household or individual incomes in a specific ZIP code. The most common sources are the U.S. Census Bureau’s American Community Survey (ACS), as well as commercial providers like 360 Real Estate Reports. These sources combine surveys, tax records, and property data to paint a clear local picture.
How Accurate Is Zip-level Data Compared To City Or County Data?
ZIP-level data is usually accurate for larger ZIP codes with thousands of residents. Small or rural ZIPs may have estimates based on samples. While city or county data is more stable, it often hides important differences between neighborhoods. Always check the date and sample size for your ZIP.
How Often Should I Update My Zip Market Research?
It’s smart to review your key ZIP codes every quarter, especially in fast-changing markets. Annual updates are a must, but quarterly checks can catch new trends, shifts in competition, or changes in income that impact your business.
Can Zip Income Data Predict Business Success?
ZIP data is a powerful planning tool, but it does not guarantee sales, rankings, ad results, or business growth. Use it to find promising areas, avoid obvious mistakes, and shape your local strategy—but always test and adapt as you go.
How Can I Get A Free Zip Market Preview?
Some providers, including 360 Real Estate Reports, offer a Free ZIP Market Preview to help you see local trends before investing in full reports. Check their website for availability and sample reports.
—
If you’re planning to launch a campaign, open a new location, or simply want to understand your best local opportunities, don’t rely on citywide guesses. Use ZIP income data and related signals to get a true edge. Explore a Free ZIP Market Preview from 360 Real Estate Reports today—see the story behind the numbers before you make your next move.
*Disclaimer: Market data supports planning but does not guarantee sales, rankings, ad results, or business performance. Always use multiple sources and local expertise when making key business decisions.*