
Local Growth Areas: Unlocking Opportunities for Smart Investment

May
Local Growth Areas: How ZIP-Level Market Data Drives Smarter Local Business Decisions
Understanding local growth areas is essential for real estate agents, mortgage brokers, insurance professionals, home service providers, local marketers, and small business owners. The difference between guessing and knowing the true potential of a neighborhood often comes down to the quality of ZIP-code level research. With competition rising and margins tightening, local professionals need more than just intuition or broad citywide trends. They need to see the real story—block by block and ZIP by ZIP.

Relying on high-level city or county data can lead to costly mistakes. Local markets are not all the same, even within the same city. Two neighborhoods separated by just a few streets can have wildly different demographics, incomes, housing dynamics, and business activity.
This article explains why ZIP-level research matters, which local signals to review, how to use the data, and the most common mistakes businesses make when selecting their next growth area.
Why Zip-code Market Research Matters

Imagine launching a campaign, opening a new branch, or focusing prospecting efforts in a “hot” city—only to find response rates are low and costs are high. Too often, this happens because decisions are based on headlines or city averages, not local realities. ZIP-code research offers:
- Granularity: You see differences street by street, not just city by city.
- Targeting: Marketing and sales budgets go further when you focus on the right blocks.
- Risk Reduction: You avoid over-investing in areas with declining population or weak demand.
- Opportunity Discovery: Find “hidden gem” neighborhoods before competitors do.
Let’s say you want to find younger families with high incomes. Citywide data might show strong averages, but ZIP-level data can reveal which pockets actually have the most growth, new homebuyers, or rising incomes. Without this, you risk missing the best areas—and wasting resources in the wrong ones.
Key Local Signals To Review
Successful market research uses a blend of signals. Relying on just one can mislead you. Here’s what to focus on:
Demographic Data
Understanding demographics helps you know who lives in an area and how that is changing. Look at:
- Age distributions (e.g., lots of Millennials vs. retirees)
- Family size and presence of children
- Ethnic diversity
- Educational attainment
These factors impact everything from homebuying patterns to insurance needs. For example, ZIP codes with rising young adult populations are often prime for starter homes, rental units, or family-focused services.
Housing Trends
Housing signals reveal the stability, affordability, and turnover in a market. Key indicators include:
- Median home values
- Homeownership rates vs. rentals
- Housing inventory (homes for sale or rent)
- Construction activity
- Vacancy rates
If a ZIP code shows rapidly rising prices, low vacancies, and new construction, demand is likely strong. Conversely, high vacancies or falling prices can signal trouble or opportunity, depending on your business.
Income Profiles
Income data is crucial for pricing, product selection, and marketing strategy. Focus on:
- Median household income
- Income distribution (how many high vs. low earners)
- Poverty rates
For example, home service businesses and insurance agents may target ZIP codes with more dual-income families, while mortgage brokers might look for areas where incomes are catching up with housing costs.
Population Growth And Movement
Population trends can signal emerging markets or areas in decline. Review:
- Population growth rates (year-over-year)
- Migration patterns (inflow/outflow)
- Density changes
Growing ZIP codes often attract new businesses and investment. Declining ones may offer less competition but more risk.
Local Business And Location Signals
Business activity data gives clues to spending power, competition, and market saturation:
- Number and type of local businesses
- Business openings/closures
- Retail and service density
- Foot traffic and accessibility
A ZIP code with rising business openings and strong foot traffic is a healthy environment for new ventures or partnerships.

Credit: wfrc.utah.gov
How To Use Local Data For Smarter Decisions
Effective use of ZIP-level data can transform every stage of your business process—from advertising to expansion. Here’s how:
Before Advertising
- Laser-targeted ads: Use demographic and income profiles to select ZIPs where your message will resonate.
- Channel selection: For example, younger ZIP codes may respond better to digital ads, while older populations might prefer direct mail.
- Budget allocation: Shift spend toward areas with higher response potential and less wasted reach.
Before Prospecting
- Prioritize high-potential leads: Focus on ZIPs with rising incomes, population growth, or new housing.
- Personalize outreach: Reference local trends when reaching out (e.g., “Many families in your area are upgrading to larger homes”).
- Avoid dead zones: Skip areas with declining population or weak business activity.
Before Expanding Or Opening A Location
- Site selection: Match your business type to ZIPs with compatible demographics and limited competition.
- Risk assessment: Use housing and business data to evaluate long-term stability.
- Product/service fit: Adjust offerings to match the needs and spending power of the area.
Before Choosing A Target Market
- Rank ZIPs by key signals: Compare areas by population growth, income, housing turnover, and business density.
- Spot micro-trends: Catch shifts before they appear in broader city or state data.
- Test and validate: Pilot in top ZIPs before scaling up.
Practical Example: Using 360 Real Estate Reports
360 Real Estate Reports bring together demographics, housing, income, population, and business signals at the ZIP-code level in one view. For instance, a local insurance agency used a 360 report to compare three nearby ZIP codes for a new office. While all ZIPs looked similar at the city level, the report revealed:
- ZIP 1 had younger families, rising incomes, and low competition.
- ZIP 2 had declining population and an aging demographic.
- ZIP 3 had high business density, but also high market saturation.
The agency chose ZIP 1. Within 6 months, policy sales grew 30% faster than their city average.
What Happens When You Skip Zip-level Analysis
Many businesses still choose target areas based on “gut feel,” broad city stats, or word of mouth. The risks include:
- Overestimating demand: City averages may hide weak local markets.
- Wasting ad spend: Reaching people who can’t afford or don’t need your service.
- Missing new competitors: Not seeing saturation until it’s too late.
- Entering declining neighborhoods: Population loss and weak income can mean slow sales.
A real example: a home cleaning service launched citywide mailers based on high city average income. Most responses came from just three ZIP codes. The rest of the campaign produced very few leads—an expensive lesson in why local data matters.
Comparing Zip Codes: What To Look For
To make better decisions, compare ZIP codes across several dimensions. Here’s a sample comparison:
| ZIP Code | Population Growth (5yr) | Median Household Income | Median Home Value | Business Openings (last year) |
|---|---|---|---|---|
| 90210 | +6.2% | $142,000 | $2,100,000 | 15 |
| 91335 | +2.1% | $82,000 | $790,000 | 21 |
| 90034 | +4.7% | $101,500 | $1,200,000 | 11 |
This kind of side-by-side view makes it clear which areas are growing, affluent, and attracting new businesses.

Credit: www.ohioarea14.org
Case Study: Real Estate Agent Targeting
A real estate agent wanted to increase listings in a large city. Instead of using citywide averages, she accessed ZIP-level data:
- Identified 5 ZIP codes with above-average growth, many homes in the $300K–$500K range, and rising school enrollments.
- Tailored her marketing to young families in these areas.
- Within a year, her listing volume increased by 40% in target ZIPs, while her citywide growth was only 12%.
Key takeaway: ZIP-level targeting allows for customized messaging, better client fit, and higher conversion.
Data Table: Demographics And Business Density
| ZIP Code | % Age 25-44 | % Homeowners | Retail Businesses per 1,000 People |
|---|---|---|---|
| 75001 | 39% | 62% | 3.4 |
| 75006 | 27% | 54% | 2.1 |
| 75007 | 33% | 71% | 2.8 |
ZIP 75001 stands out for younger adults and business density, while 75007 has the highest homeownership.
Non-obvious Insights Most Businesses Miss
Even experienced professionals sometimes overlook:
- Micro-shifts in population: A ZIP can have stable overall numbers but big changes in age or income groups. For example, if young families are moving in and retirees are moving out, the needs for schools, childcare, and family services rise.
- Business saturation signals: More businesses opening is good—up to a point. If growth outpaces population or income, competition may erode profits for everyone.
- Mismatch between housing and income: Some ZIPs have high home values but stagnant incomes, which can signal affordability stress or future slowdowns.
- School enrollments as leading indicators: Rising school numbers often predict more family-oriented spending and housing demand before the population stats catch up.
- Infrastructure changes: New transit lines, parks, or shopping centers can rapidly shift ZIP-level dynamics, opening up fresh opportunities.
How Local Marketers And Service Businesses Use Zip Data
For service businesses—home cleaning, landscaping, HVAC, pest control, and more—ZIP-level data is a goldmine. Here’s how:
- Route planning: Focus routes in high-density, affluent ZIPs to maximize efficiency and customer value.
- Seasonal forecasting: Some ZIPs may show strong seasonality (e.g., snow removal, pool services) tied to housing stock and demographics.
- Service bundling: In areas with many young families, bundle child or pet-focused services. In older ZIPs, focus on accessibility upgrades or maintenance.
- Local partnerships: Collaborate with other businesses in high-growth ZIPs for cross-promotions.
Table: Housing Trends By Zip
| ZIP Code | Median Sale Price | 12-Month Price Change | Vacancy Rate | New Construction Permits (last year) |
|---|---|---|---|---|
| 60657 | $685,000 | +8.1% | 3.0% | 48 |
| 60613 | $570,000 | +3.7% | 5.2% | 31 |
| 60614 | $910,000 | +2.9% | 2.5% | 21 |
ZIP 60657 shows high growth, low vacancy, and strong construction—a sign of a growth area.
Common Mistakes When Selecting Local Markets
Many local professionals make avoidable errors:
- Relying only on citywide or countywide averages: This blurs the differences and hides the real opportunities or risks.
- Ignoring business saturation: Too many similar businesses can quickly turn a promising ZIP into a crowded, low-margin market.
- Overlooking demographic shifts: A ZIP code losing families or seeing rapid aging may need different products or services than in the past.
- Missing infrastructure or zoning changes: New schools, highways, or retail centers can reshape demand almost overnight.
- Using outdated data: Markets change quickly. Always check the latest housing, business, and population stats.
How To Start: Steps For Zip-level Market Analysis
- Define your business goals: Are you seeking new clients, opening a location, or launching a campaign?
- Identify key market signals: Focus on demographics, income, housing, business density, and population trends.
- Gather the data: Use sources like 360 Real Estate Reports, local government databases, and census tools.
- Compare ZIP codes: Use tables and side-by-side analysis to see clear differences.
- Shortlist top areas: Pick 2–5 high-potential ZIPs for deeper research or pilot campaigns.
- Validate on the ground: Visit the area, talk to locals, and check for new developments.
- Monitor and adjust: Market dynamics change—review data quarterly to stay ahead.
Selecting The Right Data Sources
Reliable data is the backbone of good decisions. Besides 360 Real Estate Reports, consider:
- U.S. Census Bureau: For population, income, and housing stats.
- Local city planning offices: For construction permits, zoning, and business licenses.
- County property appraiser data: For housing values and ownership rates.
- Commercial real estate platforms: For business openings and foot traffic trends.
- Chamber of Commerce: For local business health indicators.
For deeper research, tools like U.S. Census Data provide robust, free ZIP-level information.
When To Update Your Local Market Analysis
Local markets can shift quickly. Review your ZIP-level data:
- Quarterly for fast-changing cities
- Semi-annually for stable or rural areas
- Before major campaigns or expansion
- After big infrastructure changes (new roads, malls, schools)
Stale data leads to missed opportunities or costly mistakes.
Using Zip Data For Team And Client Communication
Real estate teams, brokers, and marketers often struggle to show clients why one neighborhood is better than another. Presenting ZIP-level data:
- Builds trust: Clients see you have real, local knowledge.
- Sets realistic expectations: You can explain why some areas will cost more or sell faster.
- Uncovers objections early: Data-driven conversations surface client concerns before they become deal-breakers.
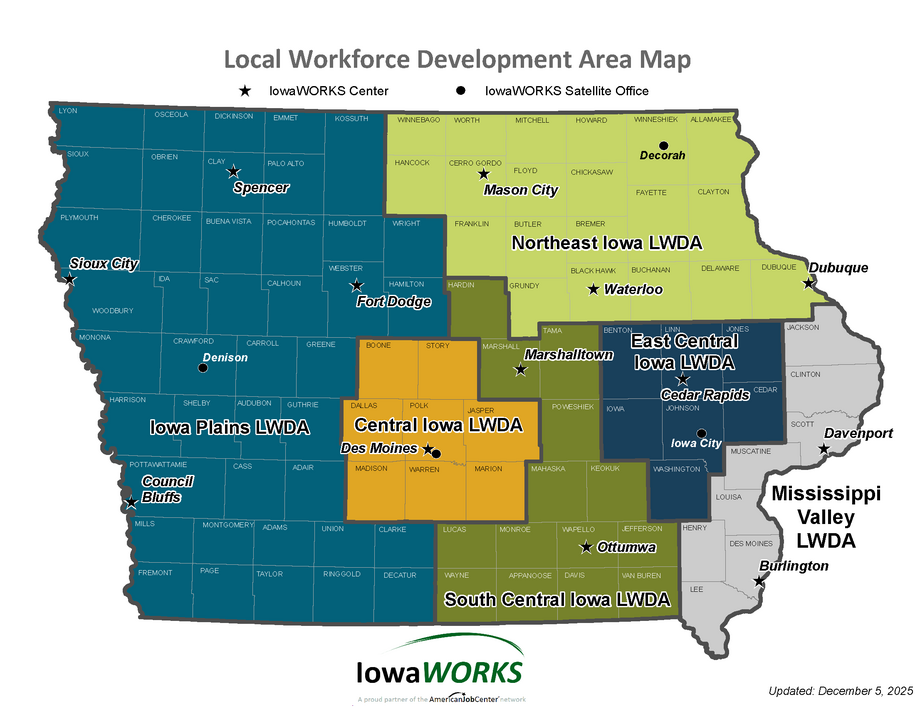
For example, showing side-by-side ZIP stats can help a buyer understand why homes in one ZIP are appreciating faster than those just a mile away.
Credit: swdb.iowa.gov
Advanced: Layering Multiple Signals For Precision
The most successful local businesses do not look at just one signal. They layer several:
- Population growth + income rise: Best for high-end services or new retail.
- Young families + new construction: Good for schools, daycare, family health.
- Aging population + low vacancy: Great for home modifications, insurance, and medical services.
- Business density + foot traffic: Ideal for retail or food service.
Layering signals gives a more complete view and reduces the risk of picking a “false positive” market.
Real-world Pitfall: Ignoring Local Business Dynamics
Suppose you open a new office in a ZIP with high income and population growth—but ignore that three competitors just launched there. Your ramp-up may be slow, and margins thin. Always check for business openings, closures, and saturation, not just raw consumer numbers.
Case Study: Insurance Agent’s Expansion
An insurance agent was considering two ZIP codes for a new branch. City averages suggested both were strong. But ZIP-level data showed:
- ZIP A had stable population, high homeownership, but new competition had recently entered.
- ZIP B had slightly lower income but was seeing a wave of first-time homebuyers and fewer competing agencies.
The agent chose ZIP B. Within a year, policy sales were 25% above forecast, and client retention was high. The difference: seeing below the city surface with local data.
Spotting Up-and-coming Neighborhoods
Not all growth areas are obvious. Early signs include:
- Increasing building permits
- Rising school enrollments
- More young adults moving in
- Declining vacancy rates
- New retail or service businesses opening
These signals often show up in ZIP-level data before news stories or city averages change.
The Role Of 360 Real Estate Reports
360 Real Estate Reports make ZIP-level research easy by integrating all major signals—demographics, income, housing, population, and business activity—in one place. Users can quickly compare ZIPs, see trends, and spot opportunities or risks that generic platforms miss. This saves time and supports more confident, data-driven decisions.
How To Get A Free Zip Market Preview
If you’re considering a new campaign, location, or prospecting area, start with a Free ZIP Market Preview. This simple report gives you an overview of local demographics, income, housing, and business signals—helping you make better decisions before you invest time and money. Contact 360 Real Estate Reports to request your complimentary ZIP Market Preview and see how local data can transform your results.
Market data supports planning but does not guarantee sales, rankings, ad results, or business performance. Always combine research with local insights and professional advice.
Frequently Asked Questions
What Is A Local Growth Area?
A local growth area is a neighborhood or ZIP code showing positive trends in population, income, housing values, and business activity. These are the places where demand, spending power, and opportunity are rising.
How Can Zip-code Level Research Help My Business?
ZIP-code research helps you target the right customers, avoid wasted spend, and choose markets with the most growth potential. It reveals local differences that city or county data miss.
Which Data Points Should I Prioritize When Evaluating Zip Codes?
Focus on demographics (age, family size), income levels, housing trends (prices, inventory), population growth, and local business density. Layer these signals for a full market view.
How Often Should I Update My Zip-level Market Analysis?
Review your analysis at least quarterly in fast-changing areas, and before any new campaign or expansion. Update immediately after major local changes like new infrastructure or big employers moving in.
Where Can I Get Reliable Zip-level Market Data?
360 Real Estate Reports offers integrated ZIP-level insights. You can also use resources like the U.S. Census Bureau for free, government-provided data.
Local market data can be your edge—start using it before your competitors do. Request your Free ZIP Market Preview today and make smarter, more confident local business decisions.